TECHNOLOGY TRANSFER
Tell me where you reside, and I’ll tell you how well (or bad) you live
CONICET researchers developed an interactive map to know the quality of life index in any part of Argentina.
Guillermo Velázquez, CONICET senior researcher at the ‘Instituto de Geografía Historia y Ciencias Sociales’ (IGEHCS, CONICET-UNCPBA) has worked for more than twenty years on the study of quality of life from a geographical perspective. His objective was to try to define, by using a numerical scale that goes from cero to ten, how well people live according to the place where they reside. The project, which focused on the Pampas region and the province of Buenos Aires at first, expanded until it covered all Argentina thanks to the collaboration of a national network of more than fifty researchers.
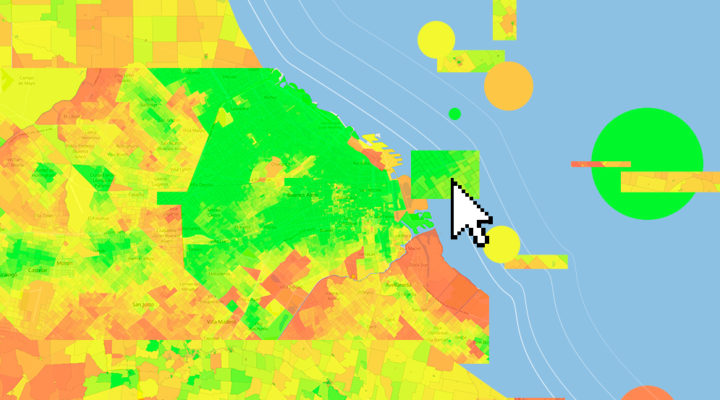
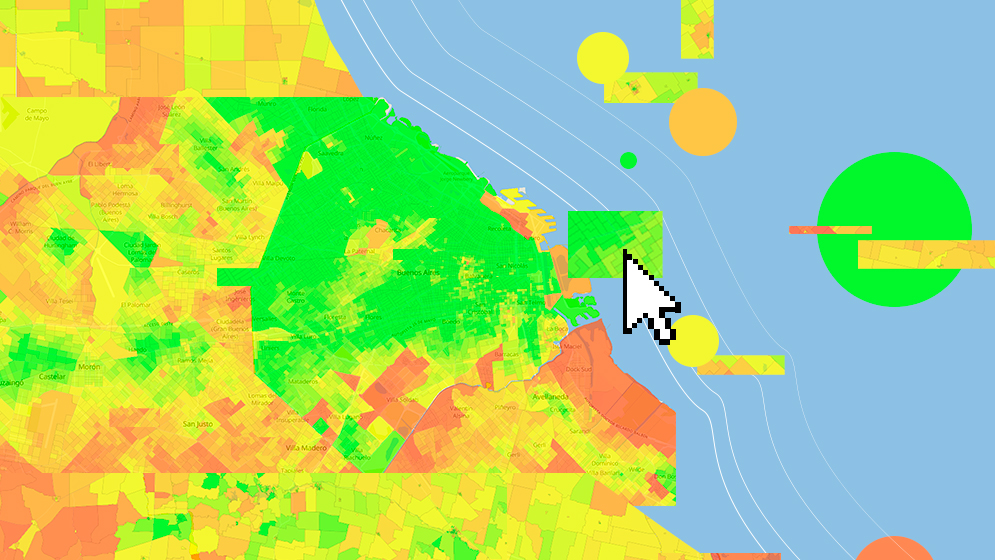
This research team has recently conducted a multidisciplinary joint study led by Alejandro Zunino –CONICET principal researcher at the ‘Instituto Superior de Ingeniería de Software Tandil’ (ISISTAN, CONICET-UNCPBA). They developed an interactive Web map to know the quality of life level in the more than 52 thousand census radius in which Argentina is divided. The larger the index in a certain place, the greener it will shown be in the map, whereas red indicates the contrary. Those who are interested can have access to the map on a website provided by CONICET. It is worth mentioning that the IGEHCS, as well as the ISISTAN are under the scope of the Scientific and Technological Center of CONICET Tandil.
“The development of this software represented a great challenge from an IT point of view because it involves real-time transference of data and the possibility of a number and high degree of accuracy in operations that are not so frequent in Web mapping apps”, Zunino explains.
The application allows users to learn that there are provinces or regions in Argentina that at glance would seem to have homogeneously good or bad quality of life, nevertheless, when you zoom in, it is possible to observe that there are areas whose reality –in terms of quality of life– contrast with the general situation that surrounds them. Take for instance downtown areas in impoverished regions that contrast with the rest, or, even in detail, with slum areas or ‘countries’ [gated communities] in some urban centers.
An index with several components
“To define the standard of living of the people who reside in a determined area, we took into account groups of socioeconomic and environmental indicators. As regards the first one, we consider data linked to dimensions such as education, health and dwelling. The environmental aspect comprises, on the one hand, typical problems that can have a negative impact on the welfare of the residents –floods, seismic, slum or polluted areas–; and on the other hand, recreational resources –which can be natural such as beaches, mountainous areas, bathing establishments, green spaces or ‘socially constructed’ places such as theaters, sports centers or other leisure activities–like those that enhance quality of life,” Guillermo Velázquez explains.
Currently, the equation used by the researchers to calculate the quality of life index (QLI) in different parts of the country assigns 60 percent of the weight to the various socioeconomic components and 40 percent to the environmental ones. However, the importance given to the environmental information has increased –it used to weight only 20 percent– according to the largest and best availability of information and the greatest social recognition of its value as regards the welfare of the population.
“Quality of life is a concept linked to the welfare of the people. It depends on certain material basis but it cannot be reduced to them. If the quality of life was merely reduced to consumption or some basic socioeconomic indicators, it would be much simpler to estimate but we are aware that this phenomenon is complex and includes other types of variables that have to do with values of society, historical expectations of progress,” the scientist states.
More and more accurate calculation
The first studies undertaken by Velázquez’s team took the provincial districts as a minimum geographical unit to calculate the QLI. That is to say, each of the 525 ‘territorial units of second order’ –the first are provinces together with the Capital City– in which Argentina is divided and includes the fifteen districts of the City of Buenos Aires and the 135 districts of the province.
“For each of these 525 units, we calculated a specific number that indicates the quality of life and made maps for each of the socioeconomic or environmental components that are part of the total calculation,” Velázquez comments.
Nevertheless, the researchers have recently refined the scale at the level of the 52.408 census radius in which Argentina is divided. In each of these, about a thousand people live in and the surfaces vary according to the population density. Of course, this adds aspects to the map that were homogeneous before.
“To move from one district scale to a census radius (which is much smaller), as regards some components –for example, the level of education reached by the inhabitants or the degree of overpopulation– we managed to process micro-data for each specific case. In the case of other components, nevertheless, such as infant mortality- we cannot go beyond the districts. In these cases, we assign the value of the district or the census fraction to each of the census radius that comprises it,” the researcher explains.
Past and future of the quality of life in Argentina
The quality of life from a geographical perspective can be calculated for the present but can also be projected backward. That was how, to make one ‘Historical and Geographical Atlas of the Republic of Argentina’, the researchers managed to design the map of the quality of life of Argentina in 1869, when the first census was taken. They did the same for the following ones in 1895, 1914, 1947, 1960, 1970, 1980, 1991 and 2001.
“The data provided by the national statistical system, which come from census, is fundamental for our work as well as the vital statistics of the Ministry of Health and Development of Argentina. To make the maps we also use our own surveys, several of them in the field.”
“Looking back, the expectations of the quality of life are growing: “The socioeconomic and environmental conditions that in the ‘50s would have been considered as an optimal quality of life, today would represent a much lower QLI,” the researcher says.
By extrapolating these conclusions towards the future, it is possible to expect that in thirty years, what today is considered as one quality of life, it can be classified as a medium level. However, the researcher points out that this does not necessarily mean that the life of most of the people will improve.
To have access to the map: https://icv.conicet.gov.ar/
For more information, look at the following sites:
For more information about technology transfer opportunities provided by CONICET, write to: vinculacion@conicet.gov.ar
By Miguel Faigón
Translation: Cintia González
About the study:
Guillermo Velázquez. Senior researcher. IGEHCS
Alejandro Zunino. Principal researcher. ISISTAN
Claudia Mikkelsen. Associate researcher. UNdMP.
Santiago Linares. Assistant researcher. IGEHCS
Juan Pablo Celemin. Associate researcher. IGEHCS
Lorena La Macchia. Associate professional. IGEHCS
Fernando Manzano. Associate researcher. IGEHCS
Adela Tisnés. Associate professional. IGEHCS